Scoring, Results Reporting, and Demographics Tabs
The Scoring Tab
Figure 4.9: New Test Dialog – Scoring Tab
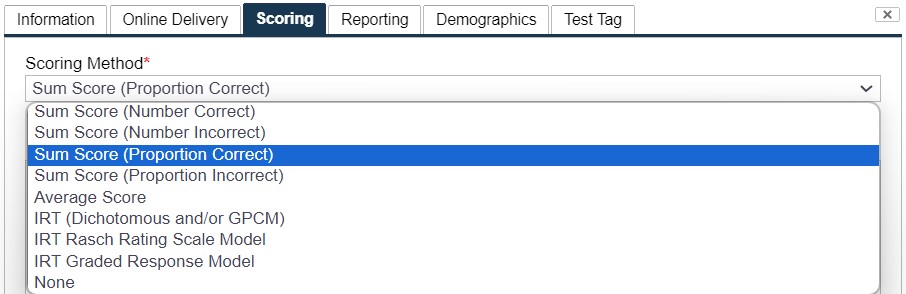
The scoring tab presents sophisticated options for scoring examinees. There are three approaches to scoring:
- Item response theory (IRT) – scores examinees directly on a standardized scale (Dichotomous or Polytomous). You can use maximum likelihood estimation or Bayesian maximum a posteriori estimation. To learn more about IRT scoring, visit Thompson (2009).
- Sum score (Number Correct) – Total number of points calculated by summing answer weights. In the case of each item being 1 point, this is the classical Number Correct score.
- Sum score (Number Incorrect) – The number of items answered incorrectly. This is useful if you want to do linear scaled scoring with a negative slope. For example, if you have a 100-item test, your scale could be Slope=-3.00 and Intercept=600, then scaled scores would range from 300 to 600.
- Sum (Proportion) Score – Scores can be reported as proportion correct using the Sum (Proportion) Score. Use the linear score conversion option with a slope of 100 to multiply a decimal fraction (0 to 1) proportion to report the score as a percentage. Cut scores use the proportion fraction for pass and fail designation (e.g. “.75”).
In addition to these base methods, you can apply scaled scoring conversions. There are four options:
- Standardized score conversion converts one standardized scale to another standardized scale. For example, with IRT you might have a mean of 0 and standard deviation of 1.0; this might be converted to a mean of 500 and standard deviation of 100.
- Linear score conversion applies a linear function with a slope and y-intercept. This can be applied to the sum and sum (proportion) scores.
- Regardless of previous options, you can set your scale to have a minimum and maximum.
- Also regardless of previous options, you can set the level of rounding on your test.
An additional option on this tab is the raw cutscore. This is for tests where examinees are classified as Pass or Fail.
- Note that the cutscore is specified on the raw (original, unscaled) metric. So in the IRT example above, a cutscore at the average would be 0.0, not 500.
The Enable Subscores option is discussed in Enabling Subscores.
The Results Reporting Tab
Figure 4.10: New Test Dialog – Results Reporting Tab

The Results Reporting tab allows you to design customized score reports for your examinees.
- Type in any static text, and then insert special text using the drop-down menu and button provided.
- For example, in Figure 4.10, the report is individualized to include the examinee name, number correct score, and number of items on the test.
- The numerical values to be entered in the report are selected using the Special Values pulldown list and the Insert button.
- For example, the test in Figure 4.10 would produce a score report for each examinee that would include the individual’s name, the number of items answered correctly, and the number of items on the test. These fields are populated with the actual values for each examinee which the score report is created at the end of the test.
To provide subscore information to test takers after their tests, follow these steps:
1) Create a table in Word that contains the subcategories and additional fields that you would want displayed to the test takers. You can populate static information in the fields that would be the same for all examinees that take that test (for example, include the Content Areas in the Word doc.)
2) Go to the particular test, right click, and select “Edit Test Options”.
3) Go to the Reporting tab and paste the table you created into the Rich Text Editor.
4) From the drop-drown menu below the Rich Text Editor, scroll to a particular subsection of the test, and select the value you want to insert.
5) Put your curser in the table where you want the value inserted, and then click Insert.
6) Do this for each of the fields in the table. Note that you only have to do this once per test. I typed in the subscore totals into Word, but you could use the drop-down to populate that column in FastTest instead also.
The Demographics Tab
Figure 4.11: New Test Dialog – Demographics Tab
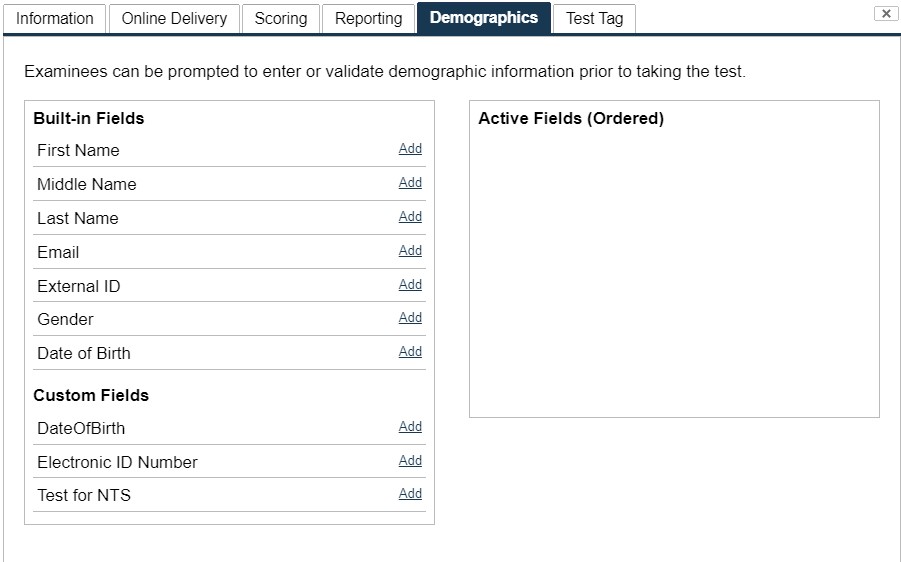
The Demographics tab enables examiners to collect demographic information about the examinees. This information is tied to the examinee as a person rather than with a specific instance of a test. Use this tab to construct the form that the examinee will be asked to complete prior to beginning the test.
The examinee will be presented with a form consisting of any number of built-in or custom fields.
- FastTest has a number of built-in fields that you can use such as First Name, Last Name, and Email.
- Workspace administrators can also define Custom Examinee fields that allow workspaces to have their own fields (see Users).
- To add a field, click the Add link, which will move the field into the Active Fields column on the right and show additional options.
- Fields can be required to be answered by checking the Required checkbox.
- If a field may already have data associated with it and you do not want the examinee to change it, you can check Read-Only If Has Value to show it to the examinee without allowing it to be changed.
- The form presented to the examinee will have the fields in the same order you define (click the Up or Down links to change the order).
- To remove a field, click the Remove link.
- If all fields are removed, future examinees will no longer see the screen with this form, but any data collected with it will be preserved.