Test and User Reports
Test Summary
The Test Summary Report covers important aspects of a test. First, it provides a summary of the status of the test, such as the number of examinees assigned and the number/percent completed so far, and the number of printed versions available. The second part provides the Response Type breakdown of the test. The third part provides the test development statistics (Figure 4.13) in the format of a report that can be provided to stakeholders.
Figure 8.7: Test Summary Report Snippet

Test Group Summary
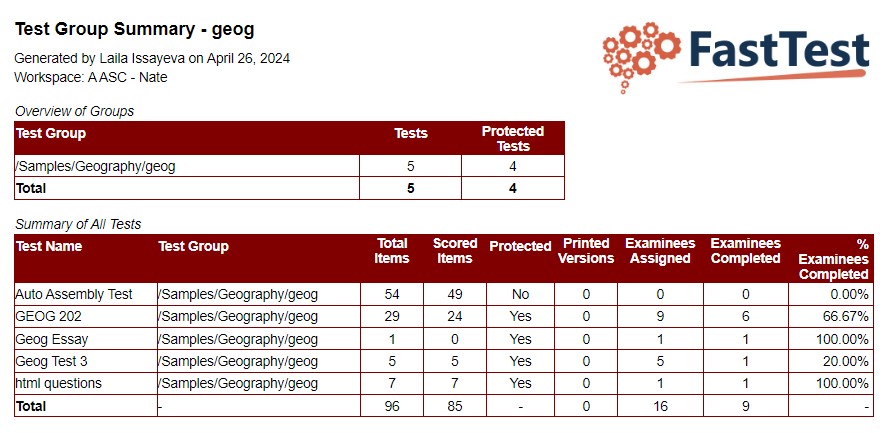
The Test Group Summary report summarizes the test-level aspects of all the tests in a test group. For example, the table below shows a group of seven Algebra tests, four of which are protected and being administered to students, while three are not yet in use.
Figure 8.8: Test Group Summary Report Snippet
Test and Item Analysis Report
The Test and Item Analysis Report (TIAR) is a report designed to allow you to evaluate the psychometric properties of your test utilizing the tried-and-true paradigm of Classical Test Theory. This report is run from the Reporting tab of FastTest, where you select which test form you would like to analyze, and (optionally) specify a date range or implement a spuriousness correction for discrimination statistics.
The spuriousness correction serves to correct the item-total point-bi-serial for the fact that the total score contains scores from the item itself, and therefore you are correlating the item with itself in some small part, which obviously inflates the correlation. The correction calculates the total score without that particular item, so that item scores can then be correlated with the total score more fairly. Note that as the test contains more items, the contribution of any one item is smaller and smaller, and the spurious correction becomes negligible. However, it can be very important in short tests, such as 20 items or fewer.
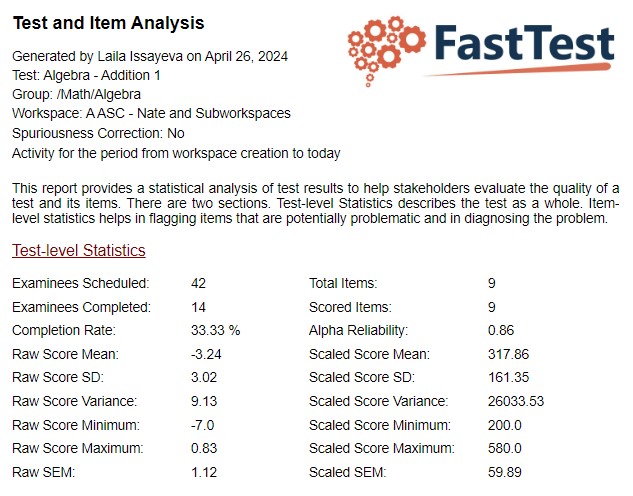
The report is divided into two primary sections. The first section provides an overview of the test as a whole. It includes simple statistics such as the number of examinees scheduled for this test, the number that actually completed the test, and the number of total/scored items on the test. It also provides statistics on the distribution of scores, including the mean (average), standard deviation, variance, minimum (lowest score observed), and maximum (highest score observed).
Arguably the most important statistic in this table is the coefficient alpha estimate of internal consistency reliability, which is a generalization of the KR20 reliability index. More information on these can be found in any psychometric textbook, but it can be broadly interpreted as the reliability (consistency) of our measurement process on a scale of 0.0 to 1.0, with 0.0 being random numbers and 1.0 being perfectly reliable measurement. The example below is a relatively accurate test, as the reliability index is 0.94.
The standard deviation and the reliability are also combined into a single index called the standard error of measurement (SEM). This is an estimate of the variation in observed scores if a person were to take the test an infinite number of times. A small number translates to greater precision in the scores.
Figure 8.9 Test-level Statistics
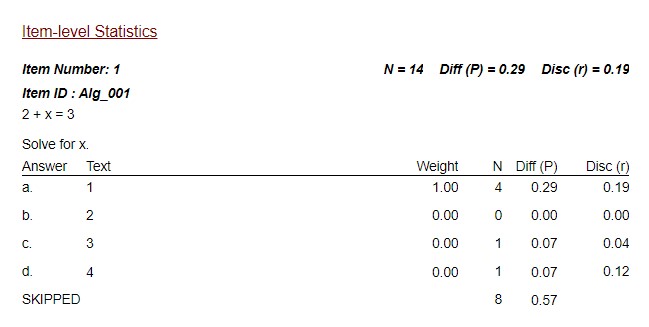
FastTest also provides a complete statistical evaluation of each item and its answers. The example below is a typical 4-option multiple choice item. The Weight column displays the points awarded for each answer, in this case just 1 point for the correct answer only. The N column shows the number of examinees that selected each answer, and the Diff (P) column converts that to a proportion (called “difficulty” but typically denoted statistically by P). In this example, 37% of the sample selected “candy” (which is the correct answer) but 37% also selected “confetti.” The Disc (r) column displays the discrimination value, as indexed by the point-biserial correlation (Rpbis), which correlates responses on that answer to the total score on the test. A positive value means that examinees of higher ability are selecting that answer. This means, in this example, that the 37% of candidates that selected “candy” were of high ability (Disc=0.49) because they knew the correct answer, while the 37% that selected “confetti” were of low ability (-0.22) as they did not know the correct answer.
The Diff and Disc for the correct answer also serve as the overall Diff and Disc.
This table is absolutely essential in diagnosing the possible reasons that an item is performing poorly. In this example we have an extremely difficult item, but we know it is still high quality because the Disc value is so high (>0.20 is typically “good”). If the Disc was close to 0.0, that would mean that examinees found the item confusing, as there was no clear correct answer. In rare cases, you might find that an answer thought to be incorrect has a high Disc value, meaning that the examinees tend to think it was correct. That item should obviously be reviewed by experts.
Figure 8.10 Item-level Statistics
User Reports
User Activity
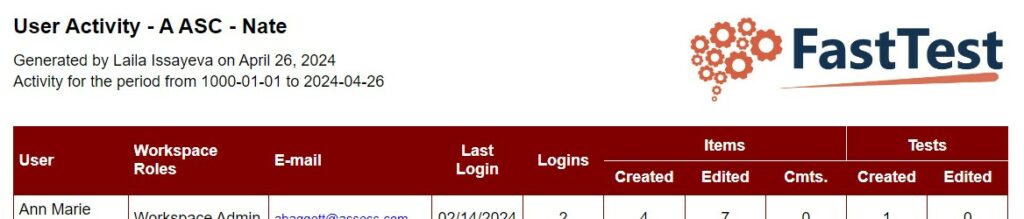
The User Activity report is available to Workspace Administrators for evaluating the productivity of users in the workspace, both at an item and test level, as shown below.
Figure 8.11: User Activity Report Snippet
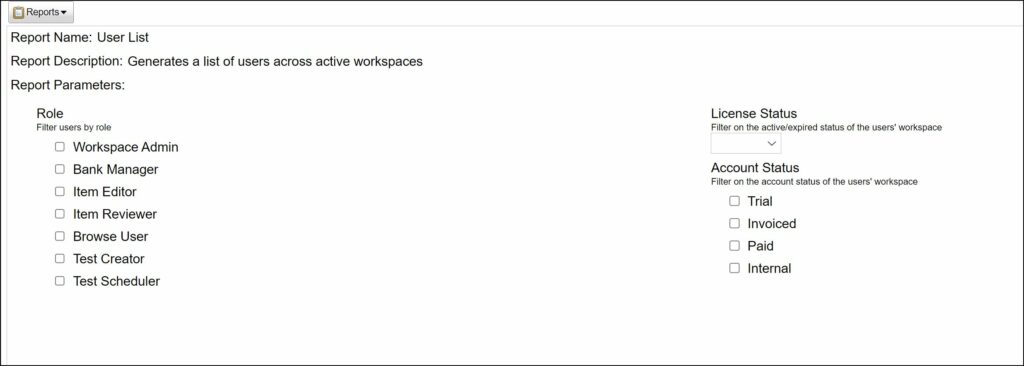
- User List
- The User List report is available to Workspace Administrators for generating a list of users across workspaces. The report can be filtered at three levels:
- User role
- Active/Expired workspace
- Account status
- The User List report is available to Workspace Administrators for generating a list of users across workspaces. The report can be filtered at three levels:
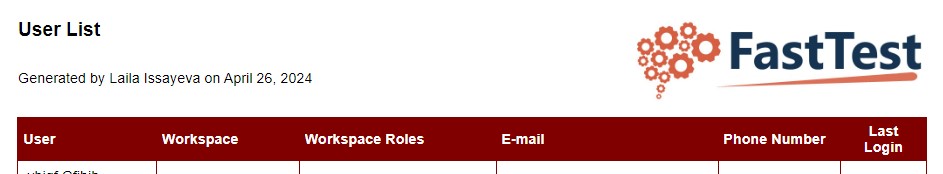
- The report will provide:
- User’s name
- Workspace
- Role
- Phone number
- Last login
Figure 8.12 User List Report
- Who’s Logged In
- This report will provide a list of all users currently logged into the workspace(s), and is only accessible to Workspace Administrators.
Workspaces Reports
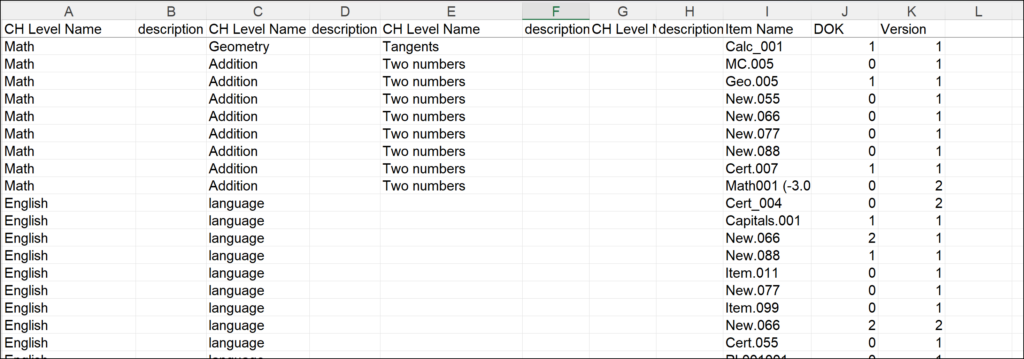
- Content Hierarchy Report
- This report will generate an XLXS file with the current content hierarchy for the workspace. An example is shown below.
Figure 8.13: Content Hierarchy Report Example
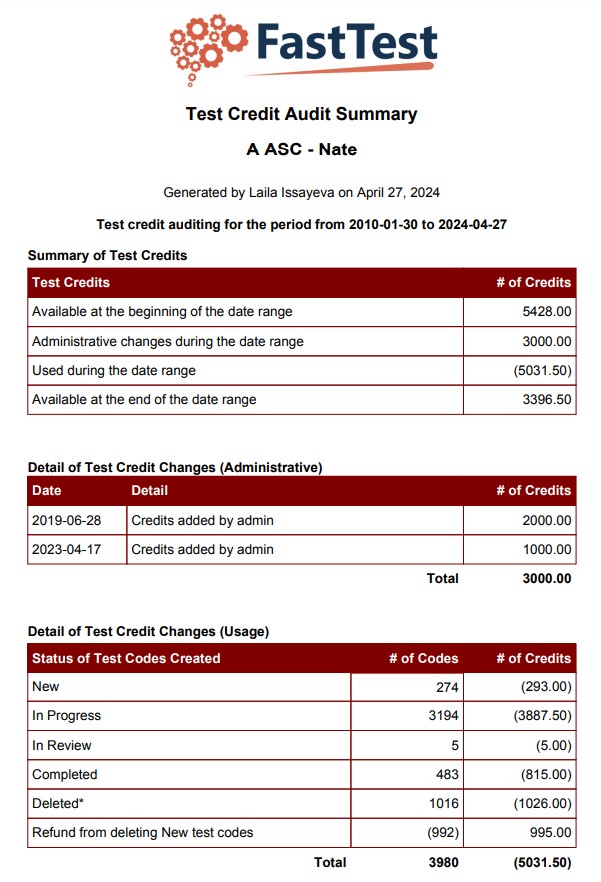
- Test Credit Audit Summary
- This report summarizes the workspace’s test credit usage, and is only available to Workspace Administrators.
Figure 8.14: Test Credit Audit Summary Example
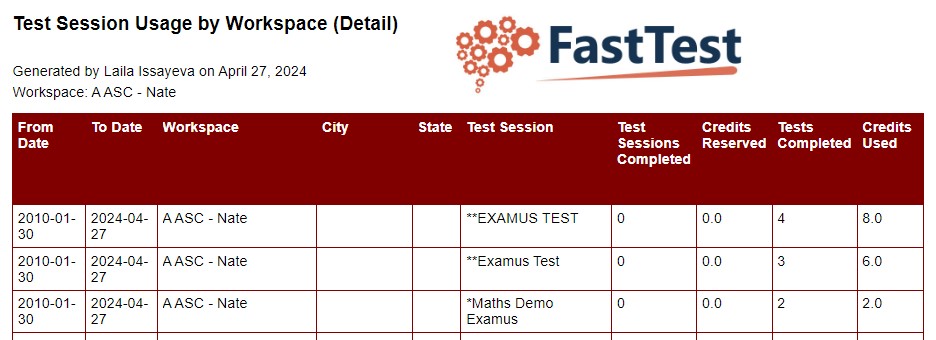
- Test Session Usage by Workspace (Detail)
- This report details which tests have been taken by which workspace. An example report is provided below
Figure 8.15: Test Session Usage by Workspace (Detail) Example
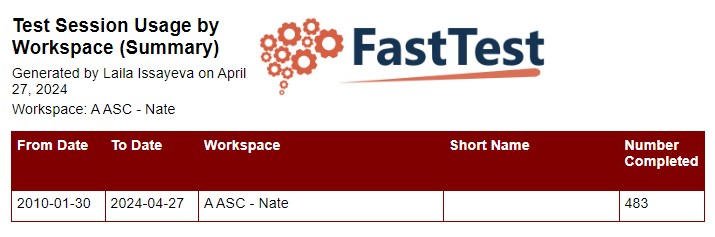
- Test Session Usage by Workspace (Summary)
- This report summarizes which tests have been taken by which workspace. An example report is provided below
Figure 8.16: Test Session Usage by Workspace (Summary) Example
Running Reports
To run a report, select the desired report from the drop-down menu. Information will then appear in the center of the screen regarding the relevant parameters of the report. For example, the User Activity report simply provides a list of user activity in a workspace for a given date range, so boxes will appear for a Start Date and End Date.
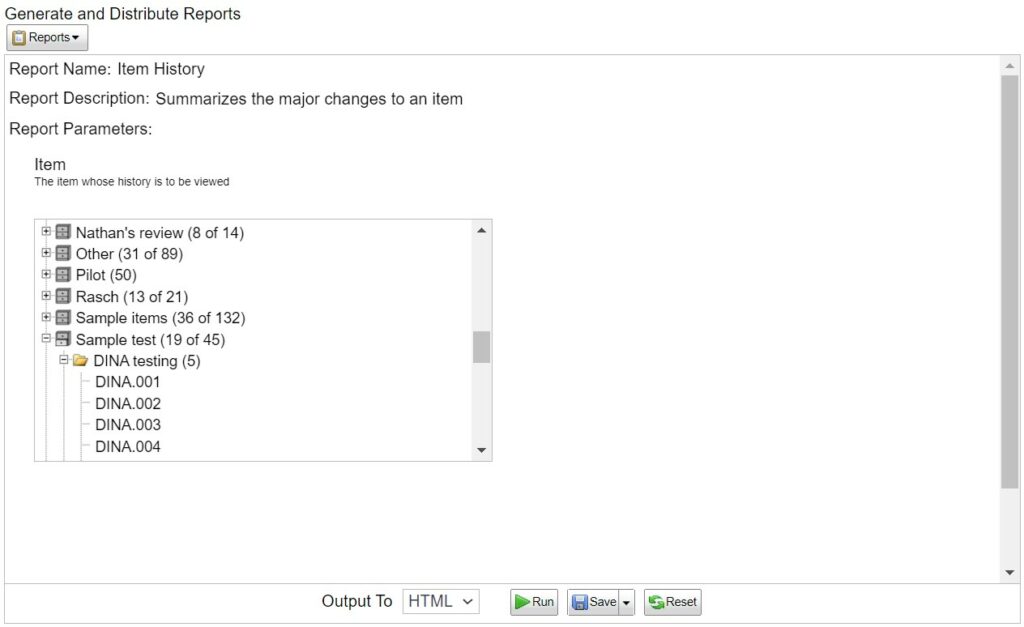
For an Item History Report, the category structure of the banks will be shown, allowing the user to navigate to the desired item, as shown in the image below.
Figure 8.17: Browsing Bank for Item History Report
The Reporting module also allows you to specify the file format of the report. HTML, PDF, DOCX, RTF, XLS, and TXT formats are supported across the reports. For the User Activity Report, a CSV format replaces the TXT format as an option. Once you have selected the format, click Run to produce the report, Save As: saves the report configurations, or Reset to start over. Saving the report will keep it in the pane on the right-hand side of the screen for quicker access in the future, if it is a report that will be used often.
Figure 8.18: Report Options
