Analytics
The Analytics tab in FastTest is the source for data-focused reporting. The Report Manager tab is devoted primarily to usage reporting, such as item banks and users. The Analytics tab, on the other hand, is focused on analyzing examinee results.
Currently there are two reports on the Analytics tab. More reports will be added in the future, including Xcalibre for item response theory calibration and SIFT for data forensics.
To begin, click on the tile for the report you wish to run.
Iteman Report
Iteman has been the industry leading software for psychometric reporting since the 1980s. Its goal is to provide advanced tools to psychometricians as well as to allow other assessment professionals to produce psychometrician-quality reports (without having to pay thousands to a psychometrician!). The new Iteman report is fully integrated into FastTest, allowing you to obtained detailed statistics and graphs on each item as well as the overall test.
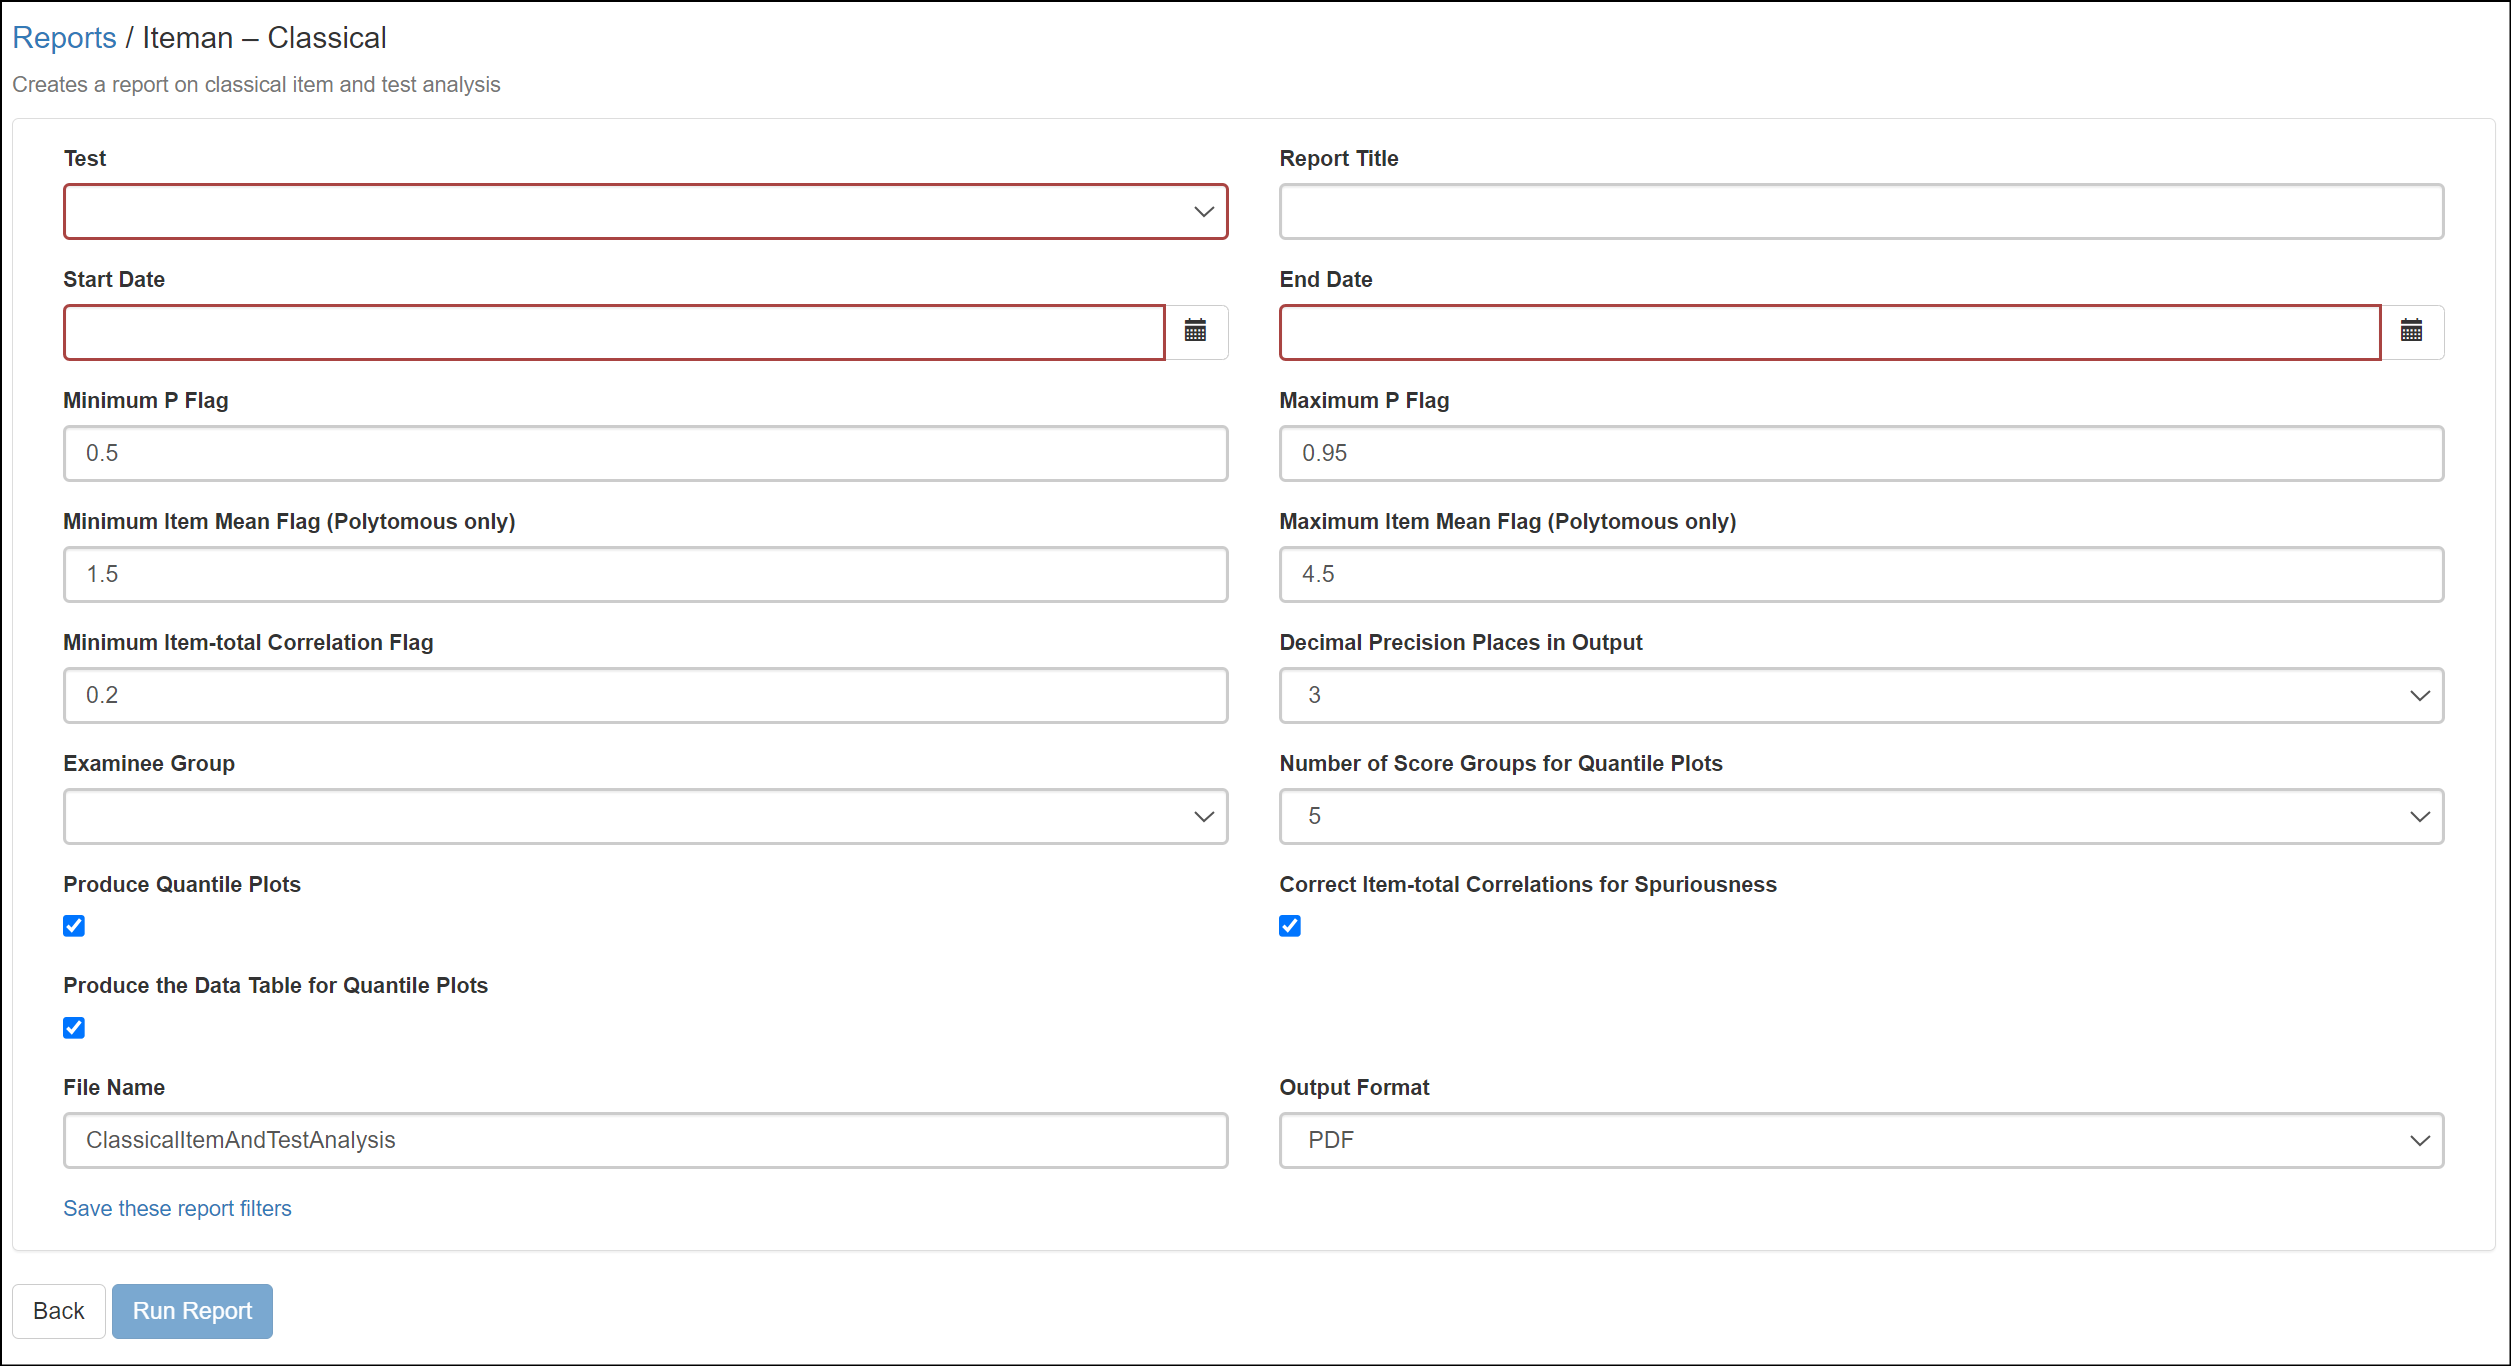
If you click the tile to start an Iteman report, you will be presented with a screen full of input options and output parameters. Red boxes are required. Specify your options to meet your needs and then click “Run Report.” When ready, a link will appear in the pane to the right.
- Flag boxes are values to be used as bounds. Items that exceed these bounds will be flagged for you, such as an item with P<0.50 (too easy).
- Examinee Group refers to the group in the Test Scheduler, if you wish to limit this.
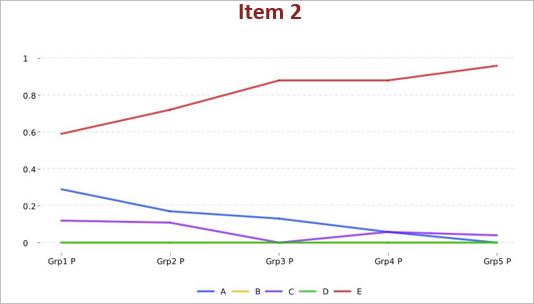
- Quantile plots are graphs used to diagnose the characteristics of an item, especially an underperforming one. An example plot is at the bottom of this page. You can change the number of groups for this plot; use fewer groups if smaller sample sizes (<100). You can also choose whether to output all the numbers for the plot in their own table.
- Spuriousness is the fact that item-total correlations are inflated by the inclusion of that item in the total score; this can be corrected by removing each item from the total score in turn.
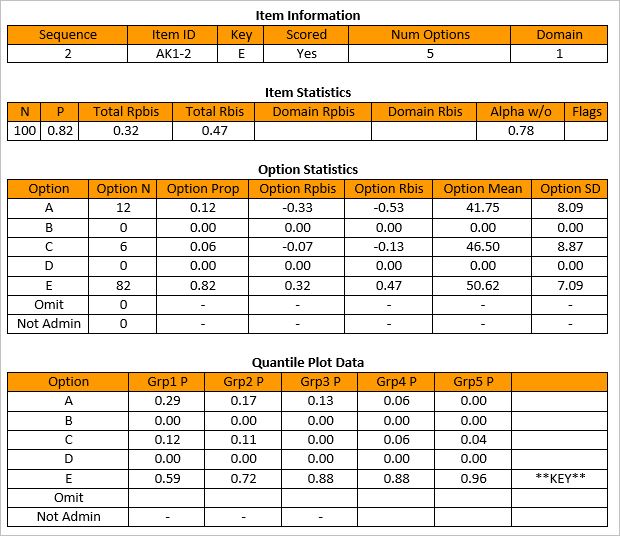
The following is an example of one item’s output. Details on statistics and interpretation are included in the report introduction. We also recommend an introductory textbook like Measurement Theory in Action.
Annual Statistics Report
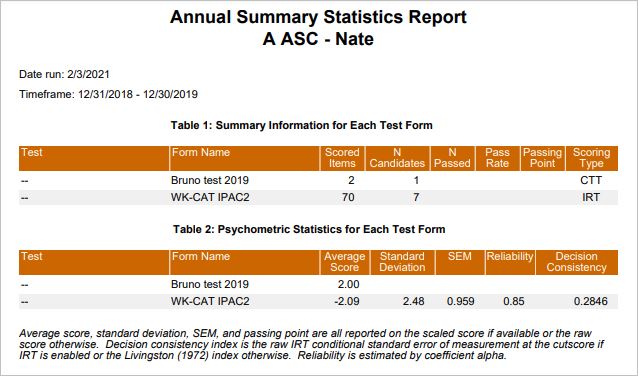
This report is designed to automate the requirements of NCCA accreditation for certification programs. At the end of each year, you are required to compile psychometric statistics on each test you deliver. Rather than pay a consultant to do this for you, you can now produce the report with a single click in FastTest. However, this report is useful for all assessment organizations, as it provides a psychometric snapshot of all your tests.
This report is pre-configured to closely align to NCCA requirements, so there are not as many options as Iteman. Simply specify your date range (usually a calendar year) and run.
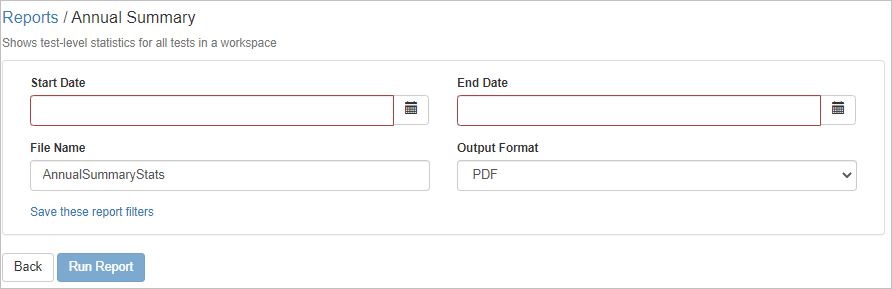
Here is an example report. This is an organization that delivers four different tests. The report was run across 4 years. Summary statistics for all examinees in that time period are provided in the table.